Manual:Troubleshooting tools
Troubleshooting tools
Before, we look at the most significant commands for connectivity checking and troubleshooting, here is little reminder on how to check host computer's network interface parameters on .
The Microsoft windows have a whole set of helpful command line tools that helps testing and configuring LAN/WAN interfaces. We will look only at commonly used Windows networking tools and commands.
All of the tools are being ran from windows terminal. Go to Start/Run and enter "cmd" to open a Command window.
Some of commands on windows are:
ipconfig – used to display the TCP/IP network configuration values. To open it, enter "ipconfig" in the command prompt.
C:\>ipconfig
Windows IP Configuration
Ethernet adapter Local Area Connection:
   Connection-specific DNS Suffix  . : mshome.net
   Link-local IPv6 Address . . . . . : fe80::58ad:cd3f:f3df:bf18%8
   IPv4 Address. . . . . . . . . . . : 173.16.16.243
   Subnet Mask . . . . . . . . . . . : 255.255.255.0
   Default Gateway . . . . . . . . . : 173.16.16.1
There are also a variety of additional functions for ipconfig. To obtain a list of additional options, enter "ipconfig /?" or “ipconfig -?”.
netstat – displays the active TCP connections and ports on which the computer is listening, Ethernet statistics, the IP routing table, statistics for the IP, ICMP, TCP, and UDP protocols. It comes with a number of options for displaying a variety of properties of the network and TCP connections “netstat –?”.
nslookup – is a command-line administrative tool for testing and troubleshooting DNS servers. For example, if you want to know what IP address is "www.google.com", enter "nslookup www.google.com" and you will find that there are more addresses 74.125.77.99, 74.125.77.104, 74.125.77.147.
netsh – is a tool an administrator can use to configure and monitor Windows-based computers at a command prompt. It allows configure interfaces, routing protocols, routes, routing filters and display currently running configuration.
Very similar commands are available also on unix-like machines. Today in most of Linux distributions network settings can be managed via GUI, but it is always good to be familiar with the command-line tools. Here is the list of basic networking commands and tools on Linux:
ifconfig – it is similar like ipconfig commands on windows. It lets enable/disable network adapters, assigned IP address and netmask details as well as show currently network interface configuration.
iwconfig - iwconfig tool is like ifconfig and ethtool for wireless cards. That also view and set the basic Wi-Fi network details.
nslookup – give a host name and the command will return IP address.
netstat – print network connections, including port connections, routing tables, interface statistics, masquerade connections, and more. (netstat – r, netstat - a)
ip – show/manipulate routing, devices, policy routing and tunnels on linux-machine.
For example, check IP address on interface using ip command:
$ip addr show
You can add static route using ip following command:
ip route add {NETWORK address} via {next hop address} dev {DEVICE}, for example:
$ip route add 192.168.55.0/24 via 192.168.1.254 dev eth1
mentioned tools are only small part of networking tools that is available on Linux. Remember if you want full details on the tools and commands options use man command. For example, if you want to know all options on ifconfig write command man ifconfig in terminal.
Check network connectivity
Using the ping command
Ping is one of the most commonly used and known commands. Administration utility used to test whether a particular host is reachable across an Internet Protocol (IP) network and to measure the round-trip time for packets sent from the local host to a destination host, including the local host's own interfaces.
Ping uses Internet Control Message Protocol (ICMP) protocol for echo response and echo request. Ping sends ICMP echo request packets to the target host and waits for an ICMP response. Ping output displays the minimum, average and maximum times used for a ping packet to find a specified system and return.
From PC:
Windows:
C:\>ping 10.255.255.4
 Pinging 10.255.255.4 with 32 bytes of data:
Reply from 10.255.255.4: bytes=32 time=1ms TTL=61
Reply from 10.255.255.4: bytes=32 time<1ms TTL=61
Reply from 10.255.255.4: bytes=32 time<1ms TTL=61
Reply from 10.255.255.4: bytes=32 time<1ms TTL=61
Ping statistics for 10.255.255.4:
    Packets: Sent = 4, Received = 4, Lost = 0 (0%
Approximate round trip times in milli-seconds:
    Minimum = 0ms, Maximum = 1ms, Average = 0ms
Unix-like:
cablefree@cablefree-desktop:/$ ping 10.255.255.6
PING 10.255.255.6 (10.255.255.6) 56(84) bytes of data.
64 bytes from 10.255.255.6: icmp_seq=1 ttl=61 time=1.23 ms
64 bytes from 10.255.255.6: icmp_seq=2 ttl=61 time=0.904 ms
64 bytes from 10.255.255.6: icmp_seq=3 ttl=61 time=0.780 ms
64 bytes from 10.255.255.6: icmp_seq=4 ttl=61 time=0.879 ms
^C
--- 10.255.255.6 ping statistics ---
4 packets transmitted, 4 received, 0% packet loss, time 2999ms
rtt min/avg/max/mdev = 0.780/0.948/1.232/0.174 ms
Press Ctrl-C to stop ping process.
From CableFree:
[admin@CableFree] > ping 10.255.255.4
10.255.255.4 64 byte ping: ttl=62 time=2 ms
10.255.255.4 64 byte ping: ttl=62 time=8 ms
10.255.255.4 64 byte ping: ttl=62 time=1 ms
10.255.255.4 64 byte ping: ttl=62 time=10 ms
4 packets transmitted, 4 packets received, 0% packet loss
round-trip min/avg/max = 1/5.2/10 ms
Press Ctrl-C to stop ping process.
Using the traceroute command
Traceroute displays the list of the routers that packet travels through to get to a remote host. The traceroute or tracepath tool is available on practically all Unix-like operating systems and tracert on Microsoft Windows operating systems.
Traceroute operation is based on TTL value and ICMP “Time Exceeded” massage. Remember that TTL value in IP header is used to avoid routing loops. Each hop decrements TTL value by 1. If the TTL reaches zero, the packet is discarded and ICMP Time Exceeded message is sent back to the sender when this occurs.
Initially by traceroute, the TTL value is set to 1 when next router finds a packet with TTL = 1 it sets TTL value to zero, and responds with an ICMP "time exceeded" message to the source. This message lets the source know that the packet traverses that particular router as a hop. Next time TTL value is incremented by 1 and so on. Typically, each router in the path towards the destination decrements the TTL field by one unit TTL reaches zero.
Using this command you can see how packets travel through the network and where it may fail or slow down. Using this information you can determine the computer, router, switch or other network device that possibly causing network issues or failures.
From Personal computer:
Windows:
C:\>tracert 10.255.255.2
Tracing route to 10.255.255.2 over a maximum of 30 hops
  1    <1 ms    <1 ms    <1 ms  10.13.13.1
  2     1 ms     1 ms     1 ms  10.255.255.2
Trace complete.
Unix-like:
Traceroute and tracepath is similar, only tracepath does not not require superuser privileges.
andris@andris-desktop:~$ tracepath 10.255.255.6
 1:  andris-desktop.local (192.168.10.4)                  0.123ms pmtu 1500
 1:  192.168.10.1 (192.168.10.1)                          0.542ms
 1:  192.168.10.1 (192.168.10.1)                          0.557ms
 2:  192.168.1.2 (192.168.1.2)                            1.213ms
 3:  no reply
 4:  10.255.255.6 (10.255.255.6)                          2.301ms reached
     Resume: pmtu 1500 hops 4 back 61
From CableFree:
[admin@CableFree] > tool traceroute 10.255.255.1
     ADDRESS                                    STATUS
   1       10.0.1.17 2ms 1ms 1ms
   2    10.255.255.1 5ms 1ms 1ms
[admin@CableFree] >
Log Files
System event monitoring facility allows to debug different problems using Logs. Log file is a text file created in the server/router/host capturing different kind of activity on the device. This file is the primary data analysis source. RadioOS is capable of logging various system events and status information. Logs can be saved in routers memory (RAM), disk, file, sent by email or even sent to remote syslog server.
All messages stored in routers local memory can be printed from /log menu. Each entry contains time and date when event occurred, topics that this message belongs to and message itself.
[admin@CableFree] /log> print
15:22:52 system,info device changed by admin
16:16:29 system,info,account user admin logged out from 10.13.13.14 via winbox
16:16:29 system,info,account user admin logged out from 10.13.13.14 via telnet
16:17:16 system,info filter rule added by admin
16:17:34 system,info mangle rule added by admin
16:17:52 system,info simple queue removed by admin
16:18:15 system,info OSPFv2 network added by admin
Read more about logging on RadioOS here>>
Torch (/tool torch)
Torch is realtime traffic monitoring tool that can be used to monitor the traffic flow through an interface.
You can monitor traffic classified by protocol name, source address, destination address, port. Torch shows the protocols you have chosen and tx/rx data rate for each of them.
Example:
The following example monitor the traffic generated by the telnet protocol, which passes through the interface ether1.
 [admin@CableFree] tool> torch ether1 port=telnet
 SRC-PORT                     DST-PORT                     TX         RX
 1439                         23 (telnet)                  1.7kbps    368bps

 [admin@CableFree] tool>
To see what IP protocols are sent via ether1:
 [admin@CableFree] tool> torch ether1 protocol=any-ip
 PRO.. TX         RX
 tcp   1.06kbps   608bps
 udp   896bps     3.7kbps
 icmp  480bps     480bps
 ospf  0bps       192bps

 [admin@CableFree] tool>
In order to see what protocols are linked to a host connected to interface 10.0.0.144/32 ether1:
 [admin@CableFree] tool> torch ether1 src-address=10.0.0.144/32 protocol=any

  PRO.. SRC-ADDRESS     TX         RX
  tcp   10.0.0.144      1.01kbps   608bps
  icmp  10.0.0.144      480bps     480bps
 [admin@CableFree] tool>
IPv6
Starting from v5RC6 torch is capable of showing IPv6 traffic. Two new parameters are introduced src-address6 and dst-address6. Example:
admin@cablefreetest] > /tool torch interface=bypass-bridge src-address6=::/0 ip-protocol=any sr
c-address=0.0.0.0/0
MAC-PROTOCOL    IP-PROT... SRC-ADDRESS                                 TX         RX
ipv6            tcp        2001:111:2222:2::1                          60.1kbps   1005.4kbps
ip              tcp        10.5.101.38                                 18.0kbps   3.5kbps
ip              vrrp       10.5.101.34                                 0bps       288bps
ip              udp        10.5.101.1                                  0bps       304bps
ip              tcp        10.0.0.176                                  0bps       416bps
ip              ospf       224.0.0.5                                   544bps     0bps
                                                                       78.7kbps   1010.0kbps
To make /ping tool to work with domain name that resolves IPv6 address use the following:
/ping [:resolve ipv6.google.com]
By default ping tool will take IPv4 address.
Winbox
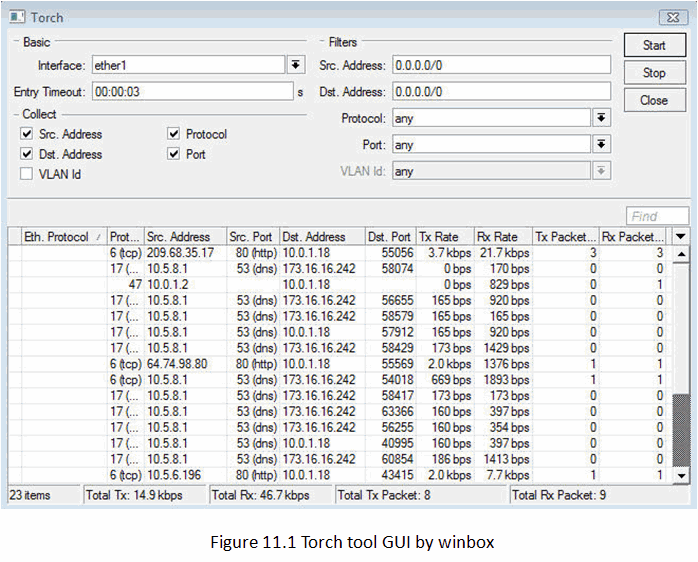
More attractive Torch interface is available from Winbox (Tool>Torch). In Winbox you can also trigger a Filter bar by hitting the F key on the keyboard.
Packet Sniffer (/tool sniffer)
Packet sniffer is a tool that can capture and analyze packets sent and received by specific interface. packet sniffer uses libpcap format.
Packet Sniffer Configuration
In the following example streaming-server will be added, streaming will be enabled, file-name will be set to test and packet sniffer will be started and stopped after some time:
 [admin@CableFree] tool sniffer> set streaming-server=192.168.0.240 \
 \... streaming-enabled=yes file-name=test
 [admin@CableFree] tool sniffer> print
             interface: all
          only-headers: no
          memory-limit: 10
             file-name: "test"
            file-limit: 10
     streaming-enabled: yes
      streaming-server: 192.168.0.240
         filter-stream: yes
       filter-protocol: ip-only
       filter-address1: 0.0.0.0/0:0-65535
       filter-address2: 0.0.0.0/0:0-65535
               running: no
 [admin@CableFree] tool sniffer> start
 [admin@CableFree] tool sniffer> stop
Here you can specify different packet sniffer parameters, like maximum amount of used memory, file size limit in KBs.
Running Packet Sniffer Tool
There are three commands that are used to control runtime operation of the packet sniffer:
/tool sniffer start, /tool sniffer stop, /tool sniffer save.
The start command is used to start/reset sniffing, stop - stops sniffing. To save currently sniffed packets in a specific file save command is used.
In the following example the packet sniffer will be started and after some time - stopped:
 [admin@CableFree] tool sniffer> start
 [admin@CableFree] tool sniffer> stop
Below the sniffed packets will be saved in the file named test:
[admin@CableFree] tool sniffer> save file-name=test
View sniffed packets
There are also available different submenus for viewing sniffed packets.
- /tool sniffer packet – show the list of sniffed packets
- /tool sniffer protocol – show all kind of protocols that have been sniffed
- /tool sniffer host – shows the list of hosts that were participating in data exchange you've sniffed
For example:
 [admin@CableFree] tool sniffer packet> print

  # TIME    INTERFACE   SRC-ADDRESS
  0 1.697    ether1    0.0.0.0:68 (bootpc)
  1 1.82     ether1    10.0.1.17
  2 2.007    ether1    10.0.1.18
  3 2.616    ether1    0.0.0.0:68 (bootpc)
  4 2.616    ether1    10.0.1.18:45630
  5 5.99     ether1    10.0.1.18
  6 6.057    ether1    159.148.42.138
  7 7.067    ether1    10.0.1.5:1701 (l2tp)
  8 8.087    ether1    10.0.1.18:1701 (l2tp)
  9 9.977    ether1    10.0.1.18:1701 (l2tp)
 -- more
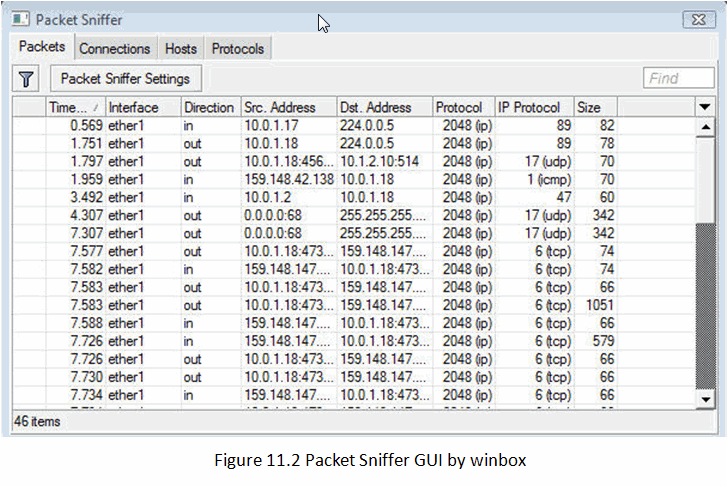
Figure below shows sniffer GUI in Winbox, which is more user-friendly.
Detailed commands description can be found in the manual >>
Bandwidth test
The Bandwidth Tester can be used to measure the throughput (Mbps) to another CableFree router (either wired or wireless network) and thereby help to discover network "bottlenecks"- network point with lowest throughput.
BW test uses two protocols to test bandwidth:
- TCP – uses the standard TCP protocol operation principles with all main components like connection initialization, packets acknowledgments, congestion window mechanism and all other features of TCP algorithm. Please review the TCP protocol for details on its internal speed settings and how to analyze its behavior. Statistics for throughput are calculated using the entire size of the TCP data stream. As acknowledgments are an internal working of TCP, their size and usage of the link are not included in the throughput statistics. Therefore statistics are not as reliable as the UDP statistics when estimating throughput.
- UDP traffic – sends 110% or more packets than currently reported as received on the other side of the link. To see the maximum throughput of a link, the packet size should be set for the maximum MTU allowed by the links which is usually 1500 bytes. There is no acknowledgment required by UDP; this implementation means that the closest approximation of the throughput can be seen.
Remember that Bandwidth Test uses all available bandwidth (by default) and may impact network usability.
If you want to test real throughput of a router, you should run bandwidth test through the router not from or to it. To do this you need at least 3 routers connected in chain:
Bandwidth Server – router under test – Bandwidth Client.
Note: If you use UDP protocol then Bandwidth Test counts IP header+UDP header+UDP data. In case if you use TCP then Bandwidth Test counts only TCP data (TCP header and IP header are not included).
Configuration example:
Server
To enable bandwidth-test server with client authentication:
[admin@CableFree] /tool bandwidth-server> set enabled=yes authenticate=yes
[admin@CableFree] /tool bandwidth-server> print
                  enabled: yes
             authenticate: yes
  allocate-udp-ports-from: 2000
             max-sessions: 100

[admin@CableFree] /tool bandwidth-server>
Client
Run UDP bandwidth test in both directions, user name and password depends on remote Bandwidth Server. In this case user name is ‘admin’ without any password.
[admin@CableFree] > tool bandwidth-test protocol=udp user=admin password="" direction=both \
address=10.0.1.5
                status: running
              duration: 22s
            tx-current: 97.0Mbps
  tx-10-second-average: 97.1Mbps
      tx-total-average: 75.2Mbps
            rx-current: 91.7Mbps
  rx-10-second-average: 91.8Mbps
      rx-total-average: 72.4Mbps
          lost-packets: 294
           random-data: no
             direction: both
               tx-size: 1500
               rx-size: 1500

-- [Q quit|D dump|C-z pause]
More information and all commands description can be found in the manual>>
Profiler
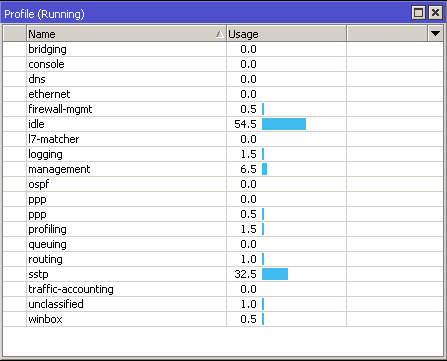
Profiler is a tool that shows CPU usage for each process running on RadioOS. It helps to identify which process is using most of the CPU resources.

[ Top | Back to Content ]

